
Power-BI Data Analyst
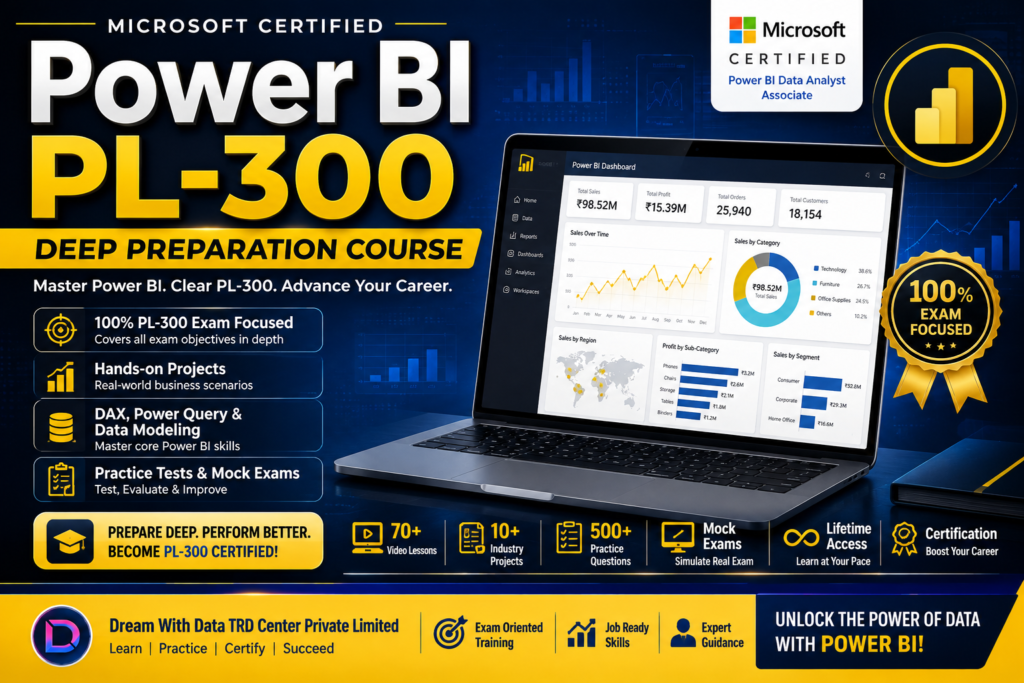
The Power BI PL-300 Deep Preparation Course is designed for students, graduates, working professionals, aspiring Data Analysts, and anyone preparing for the Microsoft Power BI Data Analyst (PL-300) certification.
You will learn Power BI from fundamentals through advanced concepts while simultaneously preparing for the certification examination.
The course focuses on both practical Power BI skills and exam preparation.
You will learn:
- Power BI fundamentals
- Power BI Desktop
- Power Query
- Data cleaning and transformation
- Data loading
- Data modeling
- Relationships
- Star schema
- DAX
- Measures and calculated columns
- Time intelligence
- Data visualization
- Interactive reports
- Dashboards
- Filters and slicers
- Drill-through
- Bookmarks
- Power BI Service
- Workspaces
- Publishing reports
- Sharing and collaboration
- Data refresh
- Security
- Row-Level Security (RLS)
- Performance optimization
- Real-world projects
- PL-300 exam-style questions
- Practice tests
- Mock examinations
Syllabus
1. Introduction to PowerBI
Free Preview
2. Identify and connect to a data source
3. DirectQuery, Import, and Dual mode
4. Parameter Values
5. Connecting to dataflow
6. Evaluating data, data statistics, and column properties
7. Resolve inconsistencies and data quality issues
8. Create and transform columns
9. Identify when to use reference queries
10. Merge and append queries
11. Table relationships
12. Designing a schema
13. Implementing role-playing dimensions
14. Using CALCULATE to manipulate filters
15. Cardinality and cross-filter direction
16. Single aggregation measures
17. Implement time intelligence measures
18. Additive, semi-additive and non-additive measures
19. Calculated tables
20. Data hierachies
21. Using the Performance Analyzer
22. Improve performancing via cardinality and summarization
23. Configuring and formatting visualizations
24. Slicing and filtering
25. Report navigation and sorting
26. Interactions between visuals
27. Sync slicers
28. Group and layer visuals by using the Selection pane
29. Design reports for mobile devices
30. Detect outliers and anomalies
31. Grouping and binning data
32. AI visuals
33. Reference lines and error bars
34. Scorecards and metrics
35. Workspaces and workspace roles
36. Workspace apps
37. Subscriptions and data alerts
38. Promote or certify Power BI content
39. Data gateways
40. Row-level security
41. Providing access to datasets
42. Module Summary Deploy and maintain assets
Certificate